 Hire Logix Labs
A market difficulty score
A 0–100 score brings four signals together. Review the underlying contributions instead of relying on a single unexplained rating.
Set more informed hiring expectations before sourcing begins. Compare local talent supply, industry demand and occupational requirements in one Excel scorecard.
$79 Secure checkout and download through Gumroad.
Market Difficulty Intelligence hosted refresh access: Purchase includes at least 12 months of hosted refresh access to the datasets included with this version, updated as the sources release new data. Future premium feeds are sold separately.
Data update schedule: BLS OEWS wage and employment estimates update annually; JOLTS hiring-demand data updates monthly. Refresh retrieves the latest validated release available through Hire Logix, which may be unchanged since your last refresh. About source updates.
Tested with Microsoft 365 Excel for Windows. Check requirements before purchase.
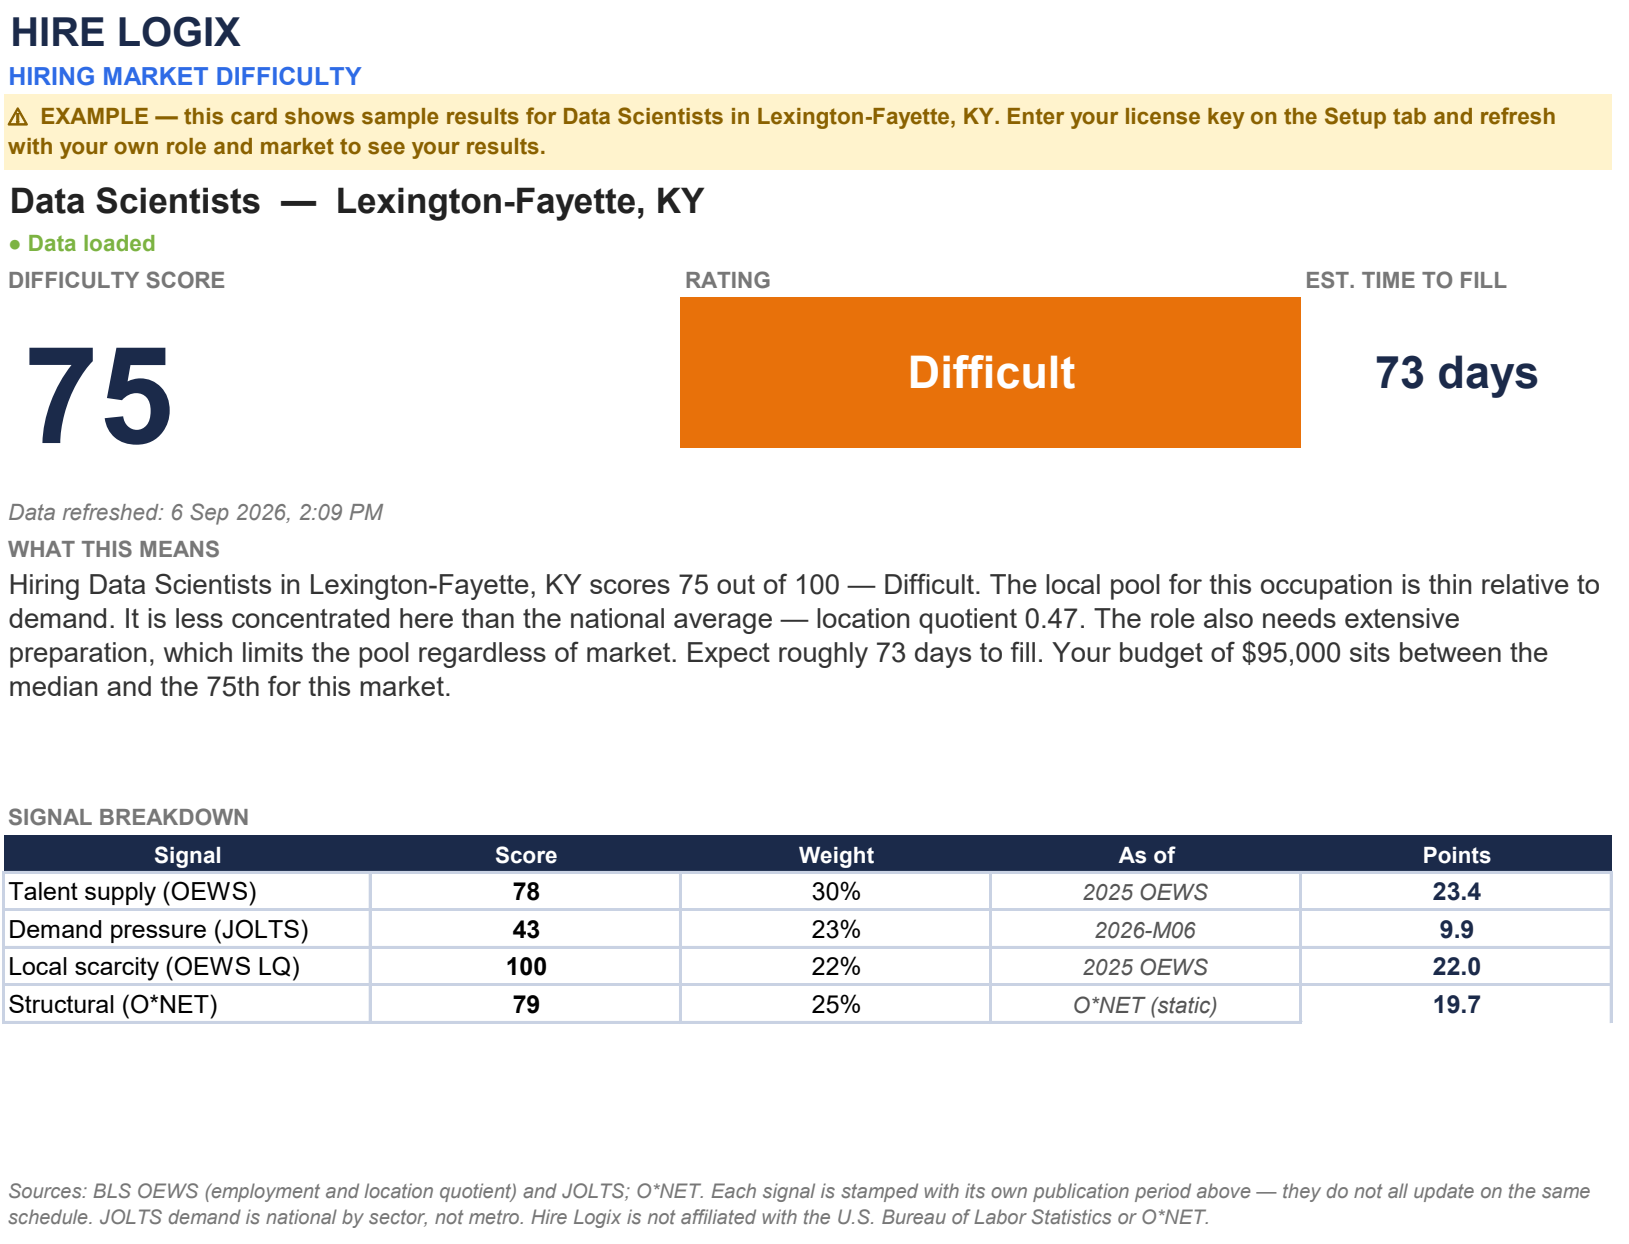
A 0–100 score brings four signals together. Review the underlying contributions instead of relying on a single unexplained rating.
Use the estimated time to fill as a starting point for your search plan. Your process, offer and sourcing approach still matter.
Review source periods, the scoring engine and adjustable weights. Compare your budget with available local wage benchmarks.
In the workbook example, Data Scientists in Lexington-Fayette score 75 / 100: Difficult.
The local occupation has a location quotient of 0.47: a smaller share of employment than the national share. Alongside talent volume and the other signals, this points to a search that deserves deliberate planning.
The model estimates 73 days to fill. Use that as a discussion starter when setting a target, allocating sourcing effort and reviewing the offer—not as a promised completion date.
Choose a role, location and your company’s industry. Get a compact scorecard using the workbook’s default scoring model and our published data.
One complimentary analysis per browser every 30 days. No email, Excel or license key required.
Employment is not a count of available candidates. Pay is context, not an input to the difficulty score. This model supports planning; it does not predict your individual hiring outcome.
Explore additional markets, inspect all four signal contributions, adjust assumptions and review budget positioning and a time-to-fill planning estimate.
Get Market Intelligence — $79Tested with Microsoft 365 Excel for Windows. 30-day money-back guarantee.
The preview uses the workbook’s default weights and static O*NET reference. Custom workbook weights will produce different results. Some occupation and market combinations have insufficient published data; those attempts do not use your complimentary preview.
We save a random browser identifier, your selected occupation, market, industry and result for up to 30 days to make your result available and limit repeat previews. We do not ask for your name or email. Your IP address is used temporarily for abuse protection and is not saved in the preview record. Clearing browser storage can remove access to your saved result. The preview may briefly limit requests from a shared network during heavy use.
Watch the Market Difficulty walkthrough, from choosing your inputs to reviewing the hiring scorecard.
| Worksheet / area | What you use it for |
|---|---|
| Scorecard | Difficulty, interpretation, planning estimate and dated signal breakdown. |
| Setup | Select a job family, role, market and industry; enter budget and license details. |
| Difficulty | Trace source inputs, sub-scores and contributions. |
| Advanced | Adjust model assumptions and weights manually. |
Review the workbook’s setup instructions and choose a supported role and market or school search.
Paste your purchase license on Setup, then choose Data → Refresh All. You do not need your own federal API keys.
Review the status and source periods. For Salary and Campus, inspect Refresh Details if a key, selection or connection needs attention.
Scores combine official data with Hire Logix model choices. OEWS coverage varies and some values are suppressed. JOLTS measures national industry demand, not local job postings. O*NET reference attributes are static in this release. Advanced weights are manually adjustable; the workbook does not train itself on your hiring history.
Market Difficulty Intelligence · Excel workbook
Secure checkout and download through Gumroad.
Try it with your recruiting workflow. If it isn’t right for you, request a full refund within 30 days of purchase.
Applies to individual products and the bundle. Read the refund policy or contact support.